online-course-dropout
| English | Português |
Spotting Students at Risk in Online Courses (OULAD)
Only about half of the Open University’s online students finish their module with a pass. This project asks who doesn’t complete, when they drop out, and how early an early-warning model can flag them, using the Open University Learning Analytics Dataset (32,593 enrolments, 7 modules, 2013–2014, 10.6 million click records).
Data: OULAD (Kuzilek, Hlosta & Zdrahal, 2017), via the UCI repository.
Plain-language summary: open the live dashboard (source), a one-page overview for non-technical readers in English and Portuguese.
More projects: Portuguese education data · Tox21 toxicity prediction · Why clinical trials stop early
Key findings
- Half of students don’t complete. 31% withdraw and 22% fail. Deprivation (65% vs 43% not completing), no prior qualifications (70% vs 44% for graduates), repeat attempts and heavy workloads all raise the risk.
- The window to act is short. 30% of withdrawals happen before the course starts, and half by day 27. Students who skip the first assignment (due around day 22) almost never pass: fewer than 1 in 20 do.
-
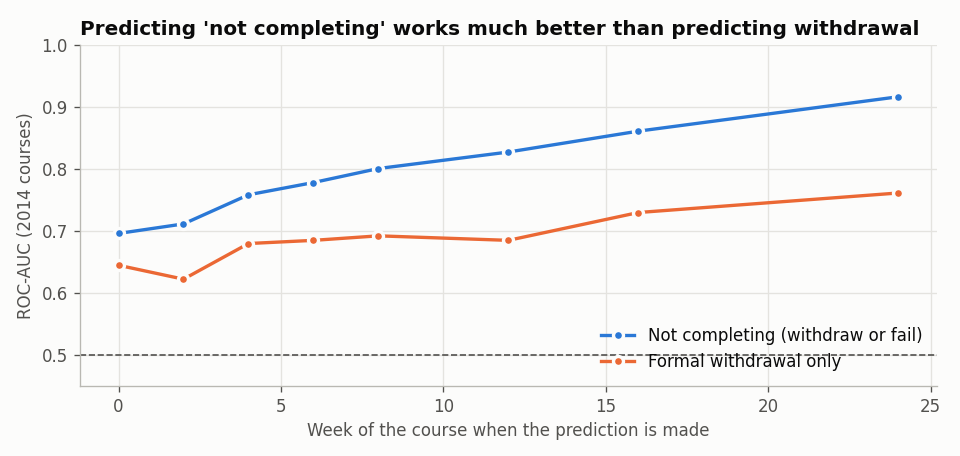
Many students disengage silently. Among students still enrolled at week 8 who didn’t log in that week, 47% go on to fail but only 21% formally withdraw. A model that predicts only withdrawal misses them.
-
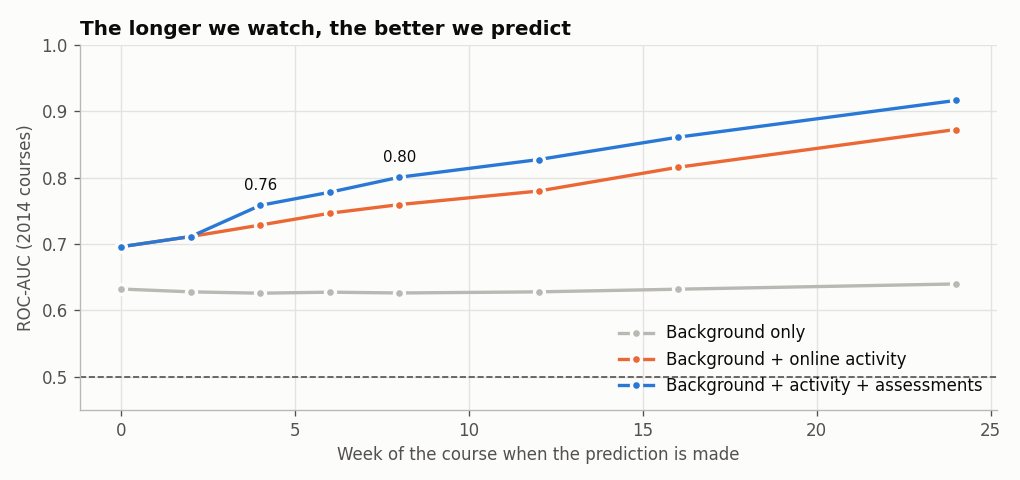
Behaviour beats background. Background alone predicts poorly (ROC-AUC 0.63). Adding online activity and assessments raises this to 0.76 at week 4 and 0.80 at week 8, when the model is trained on 2013 courses and tested on 2014.
- It works in practice.
- At week 8, about 8 in 10 of the riskiest fifth of students don’t complete.
- The model performs well on a module it never saw in training (ROC-AUC 0.83).
- Fairness: look beneath the numbers.
- At first, flags looked less accurate for women (67% vs 89% precision).
- The cause is the course mix. Women are 80–88% of two social-science modules where one global ranking over-flags (BBB) or never flags anyone (GGG).
- Ranking students within each course narrows the gap (78% vs 88%) and improves the model overall.
Method notes
- Snapshots in time: for each prediction day, features use only data up to that day. Students who already withdrew, or hadn’t registered yet, are excluded.
- Train on last year, predict this year: trained on 2013 presentations, tested on 2014.
Project structure
src/build_dataset.py     downloads OULAD; builds students, daily clicks per activity type, and assessment tables
src/features.py          snapshot(day): features and targets for every student still enrolled on a given day
src/style.py             shared chart style
notebooks/01_explore_oulad.ipynb    outcomes, background, withdrawal timing, engagement curves, silent disengagement
notebooks/02_early_warning.ipynb    target choice, AUC over time, tutor view, feature importance, unseen course, fairness
figures/                 exported charts
course-completion-at-a-glance.html   plain-language dashboard
How to run
pip install -r requirements.txt
python src/build_dataset.py     # downloads 47 MB, about a minute
jupyter notebook notebooks/
Limitations
- One university, 2013–2014. Online learning has changed since.
- Clicks are a crude measure of learning: students may work from downloaded or printed material.
- A model can only show who is at risk. Whether contacting flagged students helps would need an experiment.