clinical-trial-termination
| English | Português |
Why Do Clinical Trials Stop Early?
About 1 in 6 clinical trials is terminated before reaching its planned end. Patients have been exposed to experimental treatments, money has been spent, and the question often goes unanswered. This project analyses 46,911 phase 2 and 3 trials from ClinicalTrials.gov to find out why trials stop, which ones stop more often, and whether termination can be predicted at registration.
Data: ClinicalTrials.gov API v2: interventional phase 2/3 trials that started in 2008–2019 and are now completed or terminated.
Plain-language summary: open the live dashboard (source), a one-page overview for non-technical readers in English and Portuguese.
More projects: Tox21 toxicity prediction · Portuguese education data · Spotting students at risk in online courses
Key findings
-
Most trials don’t stop because the drug failed. The most common reasons are slow enrollment (35% of terminations), business or strategic decisions (11%) and funding (6%). Lack of efficacy (9%) and safety (5%) are less common.
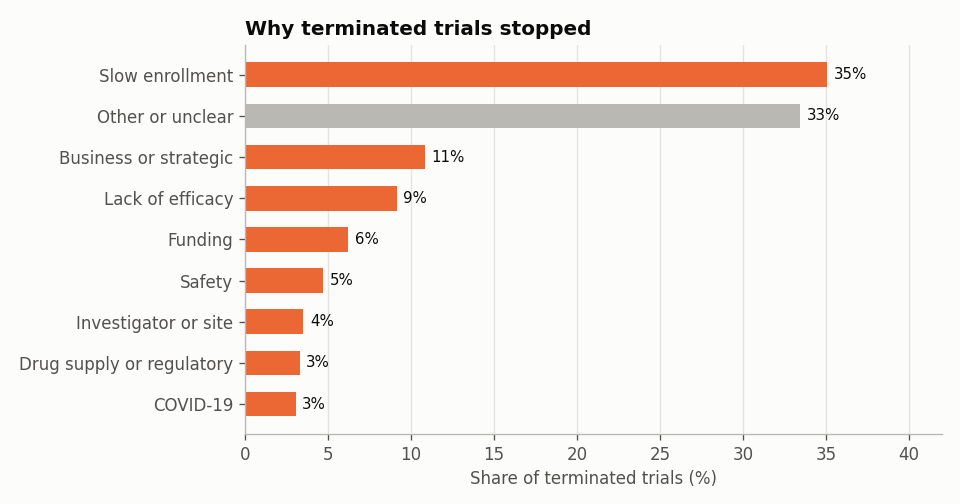
- Industry and academia stop for different reasons.
- Industry trials are stopped for business reasons (22%) and lack of efficacy (13%).
- Academic trials are stopped for slow enrollment (48%), funding (11%) and investigators leaving (6%).
- Some trials stop much more often than others.
- Cancer trials terminate most (25%), infection trials least (10%).
- Open-label and non-randomised trials stop more often than blinded, randomised ones (20–21% vs 13–14%).
- Longer, stricter eligibility criteria go with more terminations (11% to 21%).
-
Termination is only moderately predictable at registration. A gradient-boosting model tested on trials started in 2016–2019 reaches ROC-AUC 0.69, or 0.70 when blended with a text model. Even so, the riskiest tenth of trials terminated 8 times as often as the safest tenth (39% vs 5%).
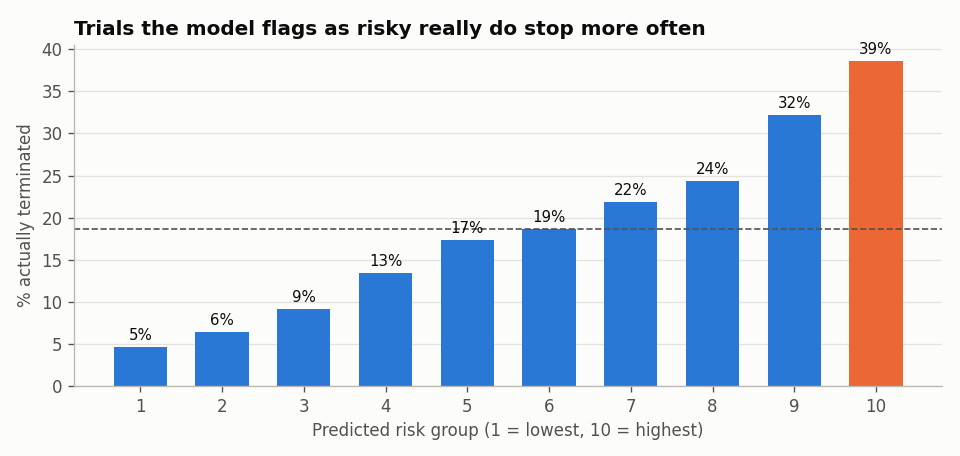
- A textbook data leak. Adding the registry’s actual enrollment lifts ROC-AUC to 0.82, but that number is only known after the trial has run. A trial that stopped early naturally enrolled fewer patients.
- Trials with a US site terminate more often (21% vs 12%). This is probably partly a reporting effect: US law requires status updates, while elsewhere quietly stopped trials often stay listed as “unknown status”.
Project structure
src/download_data.py     downloads the trials from the ClinicalTrials.gov API (~47,000 records)
src/build_dataset.py     one row per trial: design features, disease areas, text, and stopping reasons grouped by keyword rules
src/style.py             shared chart style
notebooks/01_why_trials_stop.ipynb         reasons, and termination by phase, sponsor, design, disease area and year
notebooks/02_predict_termination.ipynb     leakage, model comparison, feature importance, text model, risk groups
figures/                 exported charts
trials-at-a-glance.html  plain-language dashboard
How to run
pip install -r requirements.txt
python src/download_data.py     # a few minutes, ~185 MB
python src/build_dataset.py
jupyter notebook notebooks/
Limitations
- The registry shows each trial’s latest record, so some “registration-time” fields may have changed during the trial.
- Trials with an unknown status are excluded. They probably include many quiet terminations, especially outside the US.
- Stopping reasons were grouped with keyword rules. About a third of terminations stay “other or unclear”, including 11% with no reason given.